


This post stems from a question I was asked on the Orioles Hangout message boards. I had stated that Orioles top prospect Austin Hays has fringe speed for centerfield. Another poster responded with something to the effect of “I thought Hays had above average speed?”. I responded and clarified that it was just fringe average speed for a centerfielder, but above average speed overall. That got me thinking about whether it would be useful to have position based speed grades. Inherently, it makes some sense. The fastest catcher would be easily in the lower half of centerfielders. Different positions have different speed requirements, so why not calibrate speed grades to a player’s position?
So I did it. I used 2018 Statcast Sprint Speed data for every MLB player with 10+ competitive runs. I used this data rather than 2017 data (even though the old data have a much larger sample size) because Statcast has changed how they measure sprint speed for this season. I don’t claim to be the first person to match up scouting grades on the 20-80 scale to Statcast Sprint Speed. Jon Shepard of Camden Depot did it in an article last fall. I used the same simple method, which is to take the literal meaning of the 20-80 scale, which is that 50 is the mean of the MLB population and every 10 points in each direction is a standard deviation away from the mean.
Before I present my results, a few considerations. First, the data will likely improve as the season progresses and we get larger sample sizes. I plan on doing an update at some point later in the season. Second, the DH data is especially problematic due to the limited number of players that fit in that category and Shohei Ohtani being in the group (he’s by far the fastest in the group and he’d be an outfielder if it wasn’t for his pitching responsibilities). So, take the DH numbers with an extra grain of salt. Lastly, the “League” data consists of an update to Jon Shepard‘s 2017 work calibrating scouting grades (regardless of position) to Statcast Sprint Speed using 2018 data. The results are similar, but not identical.
Position-Based Speed Grades by Statcast Sprint Speed (ft/s)
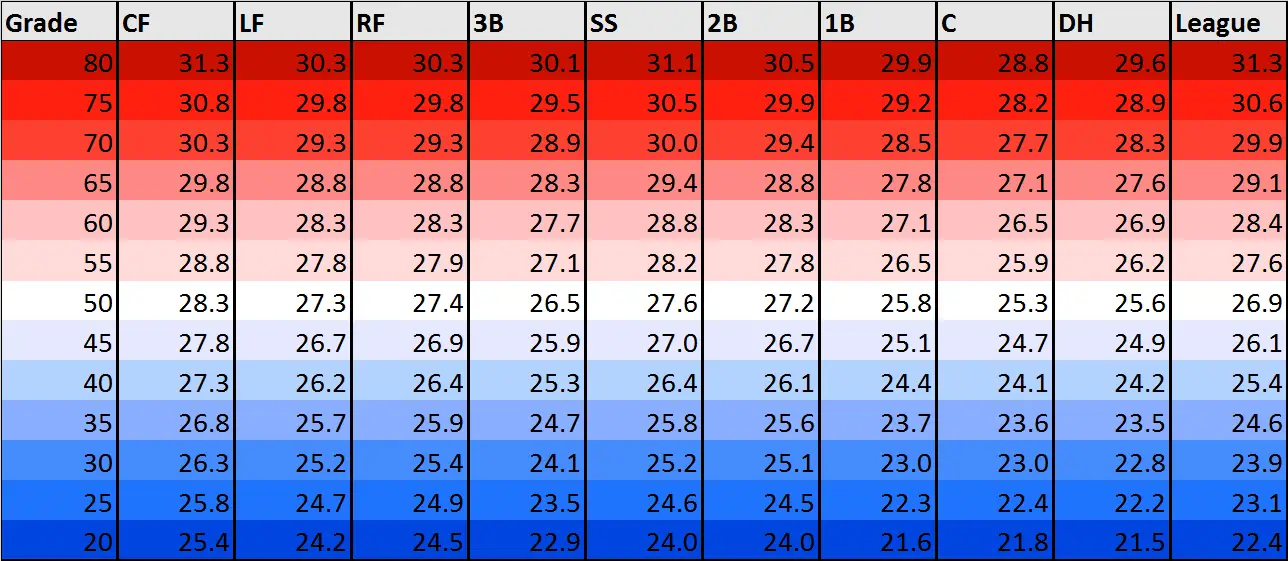
As you’d expect, CF are the fastest players as a position (using average speed). The margin between CF and the next fastest position is significant. Following CF, we have in close proximity SS, RF, LF, and 2B in that order. After another wide gap 1B, DH, and C bring up the rear. All in all, mostly as one would expect. I would have guessed 2B would have been faster than the corner outfield positions, but the results were pretty close and the data set isn’t particularly robust this early in the season.
Since this is an Orioles website, here is a chart I made with all of the 2018 Statcast Sprint Speeds for the Orioles (players with 10+ competitive runs) and corresponding grades. I’m sure some of these numbers will change as the year progresses, especially since the Orioles have played so much in the cold (which can’t be helpful for fast sprint speeds). I will also update this chart as the season progresses.
2018 Orioles Speeds and Equivalent Grades
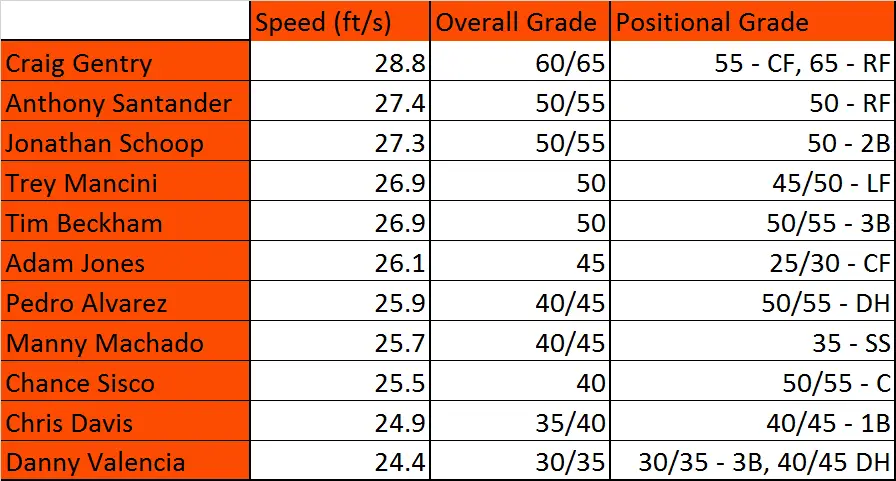
I didn’t plan on adding commentary, but I couldn’t help but be astonished by how amazingly slow Adam Jones has been for a CF. He’s last of 40 qualified CF with a sprint speed that’s over 2 standard deviations below the mean for the position. Ouch.
Discuss Here.


Comments are closed.